To win an NCAA championship, a lot of things must go right.
You need players, coaches, and the university all working together to improve and create a winning culture.
In our interview with Texas Coach Bruce Berque (listen here), he credited culture, recruiting, and player development as key factors to winning their first NCAA title.
But what is the difference between an NCAA championship team and the other teams on the court?
At Tennis Analytics, we wanted to find out, so we did what we always do. We dove into the data.
What Stats Did Texas Win?
Texas separated itself in a few key areas to take home the title this year, but which ones did they win most?
First, we’ll look at how Texas did against opponents at different rally lengths. After that, you’ll learn which areas they created significant advantages over their opponents.
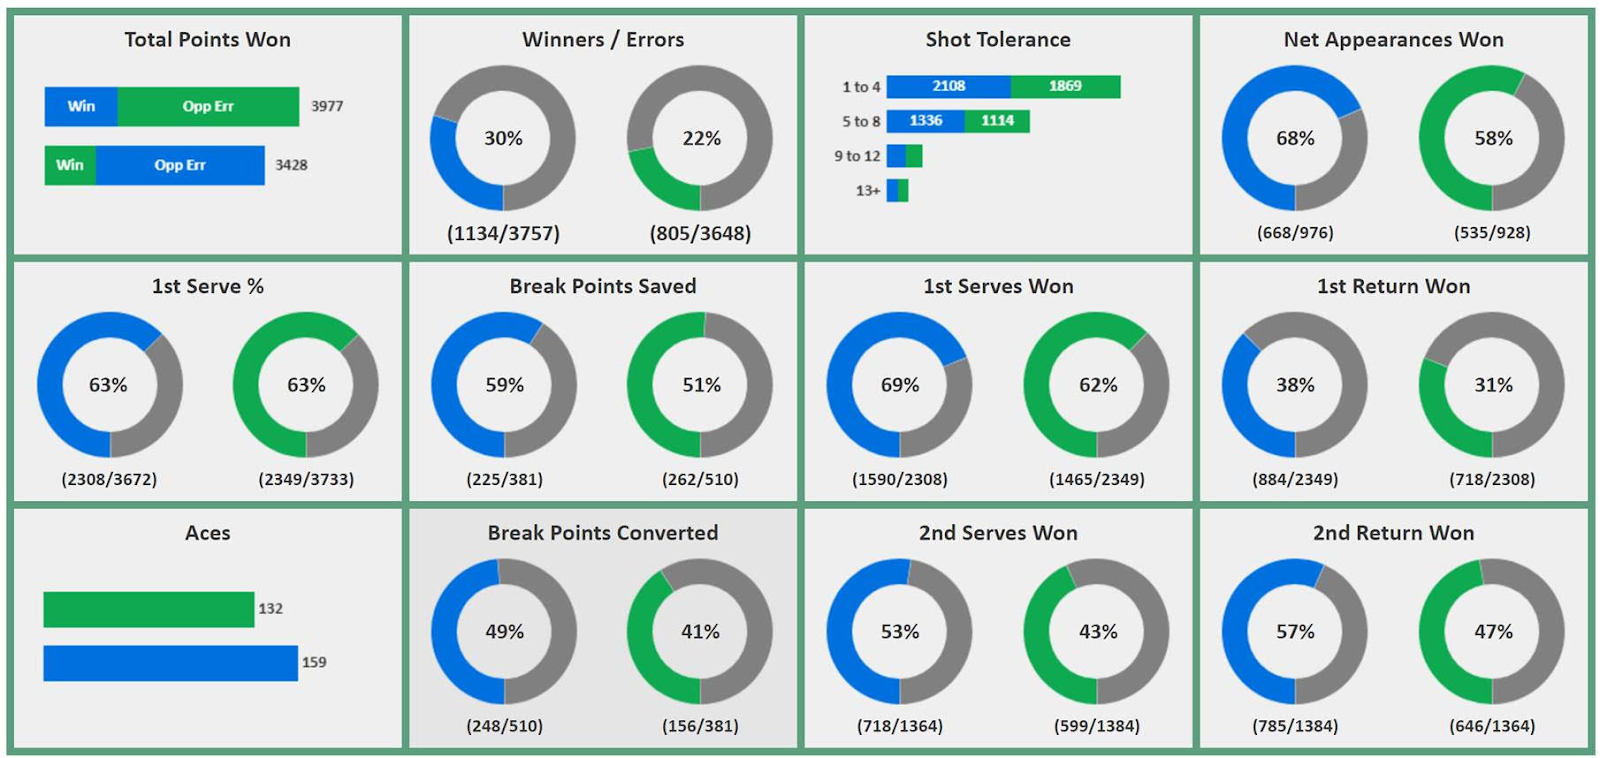
Here’s a quick look at how Texas performed vs all opponents this year. Let this be a benchmark for your team.
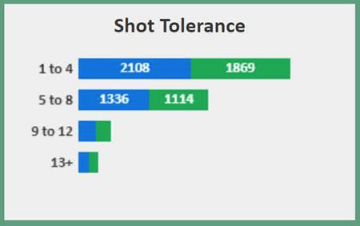
Win Percentage By Rally Length
| Rally Length | Texas | Opponent | Total | Win % |
| 1 to 4 shots | 2108 | 1869 | 3977 | 53% |
| 5 to 8 shots | 1336 | 1114 | 2450 | 54.5% |
| Total | 3444 | 2983 | 6427 | 53.5% |
So what does this tell us?
- Texas was a little better in both the short and medium-length rallies.
- As you can see by the chart, most rallies are not more than 8 shots.
- You only have to be a few percentage points better than your opponent to win the NCAA’s!
First Serve Points Won
Texas created a significant advantage with 1st serve points won.
This means Texas was 7% more likely to win the point when a 1st serve goes in, no matter the server.
They’re clearly working on 1st serves and 1st serve returns in practice.
However, when we look at 2nd serves, we find an even bigger advantage…
Second Serve Points Won
Texas actually created a bigger advantage on 2nd serves, than 1st serves.

It appears that you don’t need to win an overwhelming majority of your 2nd serves to win. Being at or slightly above 50% will separate yourself from the competition.
Texas was able to create this gap by not just being great on serves, but being better on returns to keep their opponents win percentage down.
Net Appearances Win Percentage
Texas wasn’t just better than their opponents at the net, they were MUCH better!
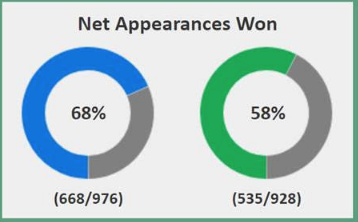
Texas won a whopping 68% of the points when they came forward vs only 58% for their opponents.
With an advantage like this, it makes sense to work on drills with your players that encourage them to come forward.
Want Even More Detailed Data for Your Team?
This is just a small sample of what kind of data Tennis Analytics can give to your team. Match stats don’t become real until you can see the actual match events. In the Tennis Analytics dashboard, stats are linked to the actual match video by use of filters. Players and coaches can easily identify tendencies at specific moments in matches. Very powerful.
You may have further questions like:
- How did Texas win a higher percentage of 2nd serve points?
- What serve locations are they hitting to?
- How often are they hitting forehands after their second serve?
We can’t give you this info for Texas, but we can for your team 😉
Email me at Warren@TennisAnalytics.net to schedule a custom demo for your team.
We’ll show you exactly how Texas and other top college programs area already using tennis analytics to improve their program.
Leave a Reply